The EUR/USD pair plunged as the Dollar Index rallied. As you already know, the USD appreciated aggressively amid geopolitical tensions. DXY's strong rally started yesterday forced the pair to drop.
Fundamentally, the US data came in mixed today. The Unemployment Claims indicator was reported at 232K versus 233K expected, the Prelim GDP surged by 7.0% matching expectations, while the New Home Sales was dropped from 839K to 801K, failing to hit 800K estimates.
In the short term, the greenback rallied but the geopolitical uncertainty could force the FED to hike its Federal Funds Rate by only 0.25% versus 50 bps expected in the last weeks.
EUR/USD Massive Drop!
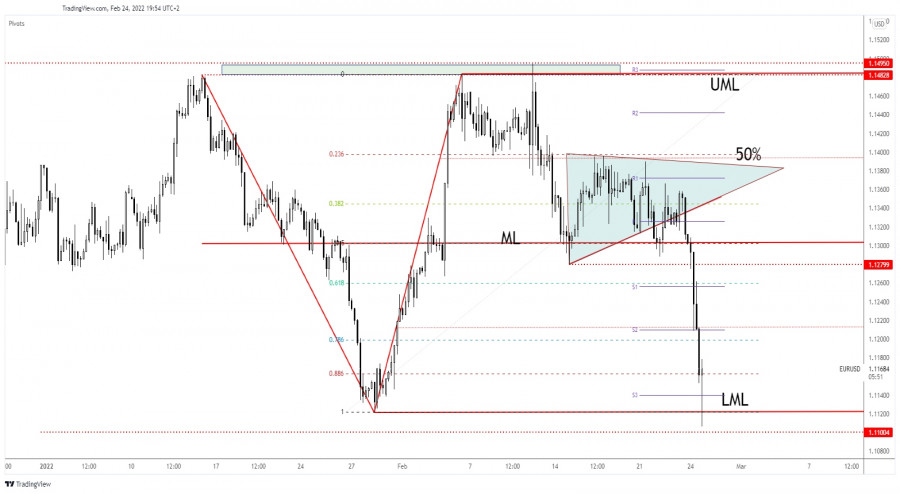
As you can see on the h4 chart, the EUR/USD pair dropped as much as the 1.1106 level registering a new low. If you remember, I've talked about a deeper drop in my previous analysis. I've said that a valid breakdown below the median line (ML) and a new lower low could open the door for a larger downside movement.
EUR/USD dropped below 1.1121 former low but it has registered only a false breakdown through this downside obstacle. After such a massive drop, a temporary rebound is natural. A temporary growth could help the sellers to catch a new sell-off.
EUR/USD Outlook!
After the sell-off, a rebound is expected, EUR/USD could come back to test and retest the near-term resistance levels before extending its drop. A temporary growth or a sideways movement could bring new selling opportunities.
Trading analysis offered by RobotFX and Flex EA.
Source #RobotFX Team
Comments
Post a Comment