The main news from the world of cryptocurrencies:
The developers of the Cardano network added support for smart contracts, which attracted new projects and greatly increased the load on the network - block occupancy exceeded 94 percent.
The network has grown rapidly in the past year, but a significant increase in transaction volume occurred just a few days ago.
The block size on the Cardano network is currently 72 kilobytes. It was increased by 12.5 percent at the end of November. Blocks now contain all generated transactions.
BTCUSD H1:
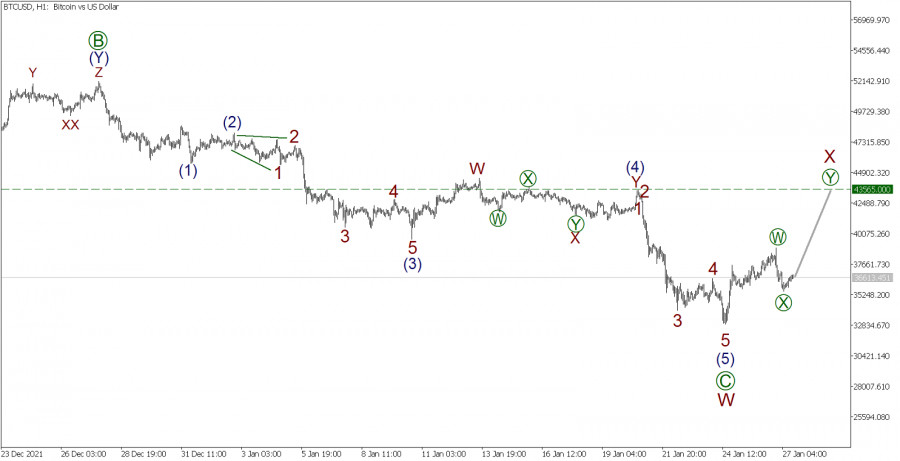
The BTCUSD cryptocurrency pair is expected to develop a downward corrective trend, which takes the form of a double zigzag. Perhaps the first active wave W was completely completed. It took the form of a simple zigzag, consisting of sub-waves [A]-[B]-[C].
Currently, we see the price increase within the wave X. Most likely, this will take the form of a double combination [W]-[X]-[Y]. It seems that the first two sub-waves [W]-[X] have already been completed. Based on this, we should expect the construction of the final acting wave [Y].
It is assumed that the price growth in wave [Y] will continue to the level of 43,565.00. Earlier, a horizontal correction into the shape of a double three was completed at this level.
Since there is a high probability of a bullish movement in this wave, it is possible to consider opening longs from the current level in order to take profit at the level of 43,565.00.
Trading recommendations:
Buy 36,613.45, Take profit: 43,565.00.
Trading analysis offered by Complex Trader - a RobotFX partner.
Source #RobotFX Team
Comments
Post a Comment