
While bitcoin is consolidating below the level of $ 40,000 per coin, we suggest speculating on how much bitcoin can and should cost. The price of any asset is determined by supply and demand, taking into account the cost. That is, figuratively speaking, bitcoin cannot cost less than the cost price, since in this case, no one will simply mine it. However, this statement is true only for the medium and long term. What does it mean? If the price of bitcoin drops below the cost price for two weeks or two months, this will not change the overall picture of the situation in any way. Miners will not give up mining, because they will know that the price will rise again. Thus, in the short term, bitcoin may very well cost less than the cost of its production. According to various estimates (in different mining locations, the cost of electricity, premises, equipment, and so on is different) the cost of one bitcoin coin ranges between 20-30 thousand dollars at the moment. The profitability of its production is 20-30% (but again, these are "average figures for the chamber"). Thus, it can be easily assumed that 60-70 thousand dollars per coin are a non-market and unfair price, which does not reflect the real cost of coin mining at all (not to mention the real cost of bitcoin itself). Therefore, all that has happened in the last 2.5 months is a decline in the price after a strong overbought.
Bitcoin is aiming for a new drop with a target of $ 31,100.
We're moving on. Bitcoin is still used as an investment tool by the absolute majority of market participants. Thus, if most of the participants start getting rid of it for any reason, then it will fall and may fall much below the cost levels. The only question is how much it will spend at levels below cost. Another mechanism starts working here. Miners will not sell the mined coins without profit or at a loss for themselves. Therefore, when bitcoin falls below the cost price, it automatically means that its supply will decrease. Therefore, everything will depend not on the miners, who will act more or less clearly, but on investors. If they continue to buy out all drawdowns, they can keep it above critical levels. But whether the cryptocurrency will be able to continue growing in the medium term, which is exclusively speculative, is a big question. Contrary to popular belief, not everyone needs bitcoin and cryptocurrencies in general. Therefore, bitcoin is becoming more and more a toy for companies and major players in the market every year, and not for ordinary people. Based on all of the above, we believe that bitcoin will continue its decline to $ 31,100, where major players will have to show again whether they can keep the rate from falling. In the area of $ 40,746 - $ 43,852, this could not be done.
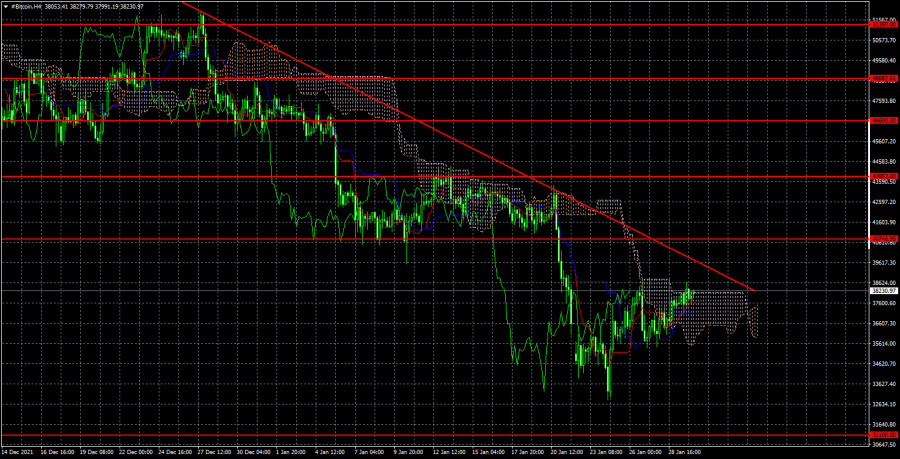
On the 4-hour timeframe, the trend remains downward. The cryptocurrency overcame the $ 40,746 level on the fourth attempt, so the decline should continue with a target of $ 31,100. We recommend considering bitcoin purchases only if there is a consolidation above the descending trend line. The targets, in this case, will be the levels of $ 40,746 and $ 43,852. But so far, buyers do not have enough strength even to overcome the Ichimoku cloud.
Trading analysis offered by Complex Trader - a RobotFX partner.
Source #RobotFX Team
Comments
Post a Comment