EUR/USD
Analysis:
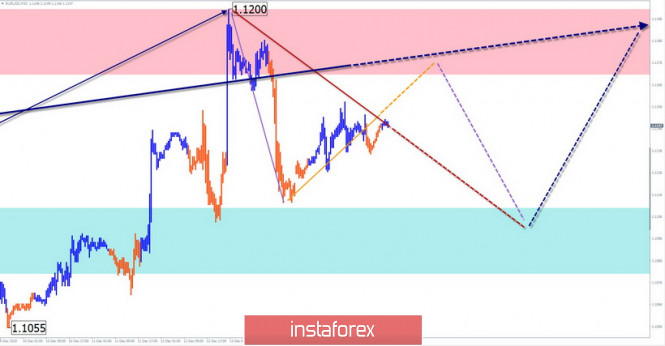
The upward wave of the euro since the beginning of September forms the main direction of the price movement. Its last section on November 14 ran into strong resistance. From it, the price rolls down. The rollback structure does not show completeness.
Forecast:
Today, the movement is expected to continue in the sideways price corridor between the counter zones. In the first half of the day, the price rise is more likely. By the end of the day, you can expect a change in the movement vector and a decline to the support zone.
Potential reversal zones
Resistance:
- 1.1170/1.1200
Support:
- 1.1110/1.1080
Recommendations:
Today, trading in the euro market is possible within the intraday according to the expected sequence. A lot more sensible to reduce. In the support area, it is recommended to monitor the signals of completion of the correction to find the entry into long positions.
AUD/USD
Analysis:
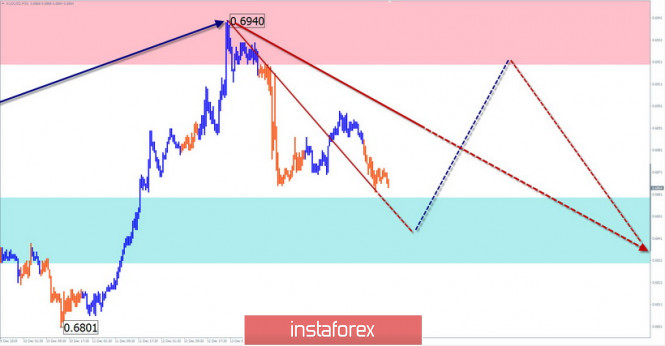
The short-term rate of Aussie quotes is directed towards the global trend of the pair to decline. The wave is formed laterally, along with strong large-scale resistance. The structure of the wave lacks the final part. The downward section from December 13 has a reversal potential.
Forecast:
Today, the probability of price movement in the lateral plane is high. The range of the daily course is limited by the nearest oncoming zones. After an attempt to put pressure on the support zone, a reversal and the beginning of price growth is expected.
Potential reversal zones
Resistance:
- 0.6920/0.6950
Support:
- 0.6860/0.6830
Recommendations:
The pair’s sales are premature today. Short-term purchases with a reduced lot are possible. In the area of the resistance zone, it is recommended to track the instrument’s sell signals.
Explanations: In the simplified wave analysis (UVA), waves consist of 3 parts (A-B-C). The last incomplete wave is analyzed. The solid background of the arrows shows the formed structure for determining the expected movement.
Attention: The wave algorithm does not take into account the duration of the tool movements in time!
The material has been provided by InstaForex Company - www.instaforex.comvia Simplified wave analysis for EUR/USD and AUD/USD for December 17
Comments
Post a Comment