GBP/USD
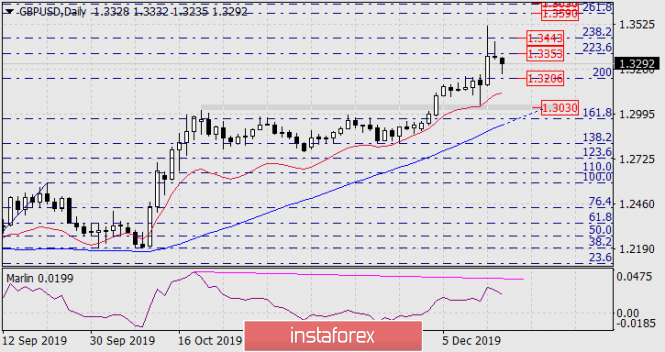
The British pound is down for the second day after its extreme growth on Friday. Western media suddenly became worried about the Brexit conditions and the options for the upcoming trade agreement with the United States, which confirmed our assertion about the speculative growth of the pound. Against this background, weakened PMIs seemed almost like a “collapse of hope”; in the manufacturing sector, PMI fell from 48.9 to 47.4 in December; in the service sector, it fell from 49.3 to 49.0 against the forecast for an increase in both indicators. Employment data will be released today in the UK; unemployment is expected to rise from 3.8% to 3.9%. We are waiting for the price reduction to the Fibonacci level of 200.0% (1.3206). Consolidation under the level will open the way to the target range of 1.3012/50, formed by the extremes on October 21 and December 12. The MACD line of the daily scale is striving in this range.
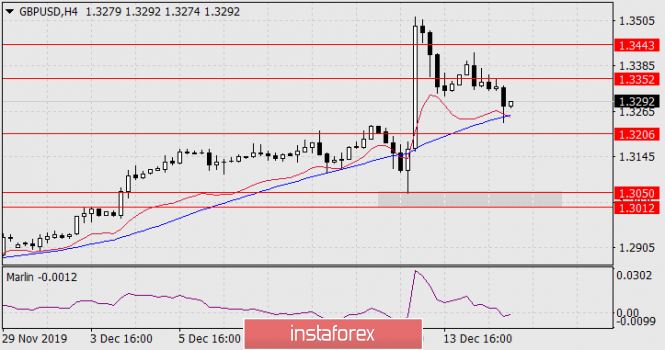
On the H4 chart, the price is struggling with the support of the MACD line (blue) and the balance line (red). Consolidation under these will be the simultaneous development of the first target level of 1.3206. Marlin indicator in the negative trend zone. Next, we are waiting for consolidation under 1.3206.
via Forecast for GBP/USD on December 17, 2019
Comments
Post a Comment