EUR / USD
On Tuesday, the euro traded at the Fibonacci level of 110.0% once again, which was helped by good data on the eurozone’s trade balance - volume in October amounted to 24.5 billion euros against the expectation of 19.7 billion. In the USA, the macroeconomic factor was not weaker: industrial production in November increased by 1.1% against the forecast of 0.8%; while the foundations were laid for new houses of 1.37 million y / y against the expectation of 1.34 million y / y. Therefore, investors preferred to take profits after a week of previous growth.
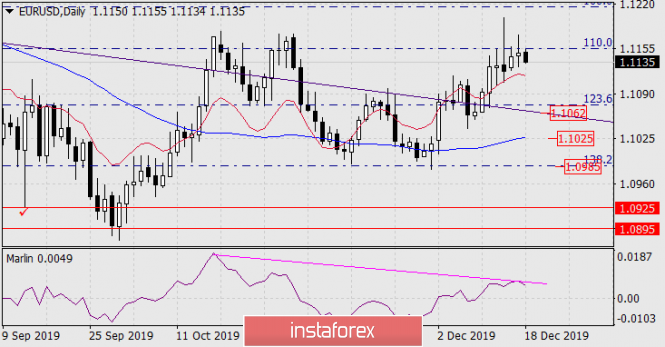
According to information from Japanese agencies, direct sales of the euro began during the Asian session today, as evidenced by higher trading volumes than on Monday. On the daily chart, divergence according to Marlin takes on a more pronounced form. Thus, we are waiting for the euro to decline to support the nested price channel line in the region of 1.1062.
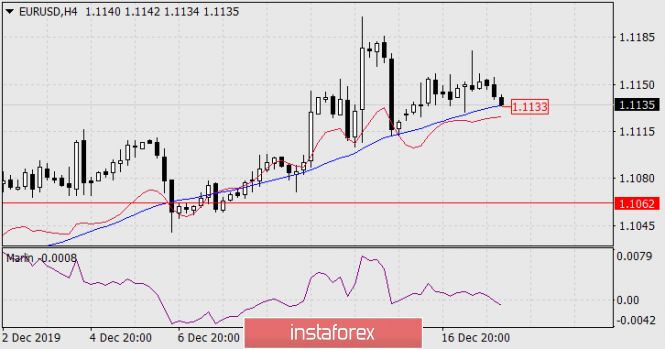
On the four-hour chart, the signal line of the Marlin oscillator penetrates into the zone of negative values - which is technically into the zone of a declining trend. Now, we are waiting for the trend to strengthen with price fixing below the MACD line (1.1133).
The material has been provided by InstaForex Company - www.instaforex.comvia Forecast for EUR/USD on December 18, 2019
Comments
Post a Comment