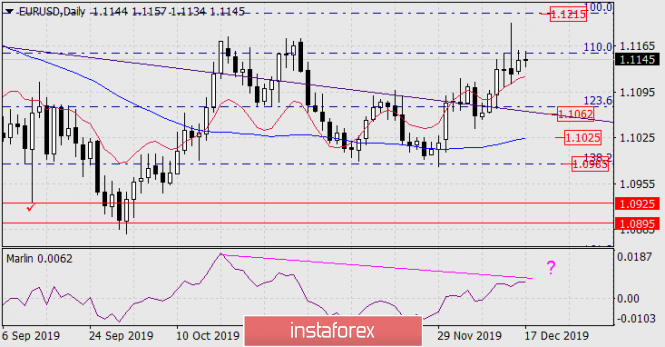
EUR/USD
As a result of Monday, the euro grew by 21 points. At the moment, the price reached the Fibonacci line of 110.0% on the daily chart, from which it retreated. Eurozone business activity indices for December came out mixed: Services PMI grew from 51.9 to 52.4, Manufacturing PMI fell from 46.9 to 45.9. The situation was similar in the US: Services PMI grew from 51.6 to 52.2, Manufacturing PMI fell from 52.6 to 52.5. Today, more important data will come out: the eurozone trade balance for October is expected to grow from 18.3 billion euros to 19.7 billion. US industrial production may show an increase of 0.8% in November, the forecast for US housing starts in November is 1.34 million against 1.31 million in October. The technical neutrality of the euro may move down due to these data. The first significant goal is the price channel line on the daily chart in the area of 1.1062. A decrease in prices by 30-40 points will form the already emerging divergence on the Marlin oscillator.
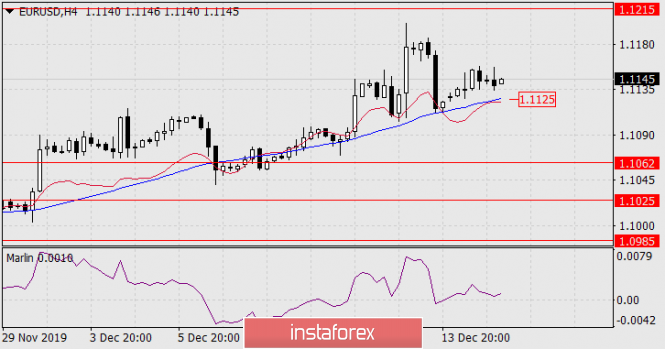
On the four-hour chart, the price is slightly higher than the MACD indicator line (blue), consolidating below it (1.1125) will significantly enhance the development of the downward movement.
Consolidating the price over yesterday’s high (this is an alternative scenario) will increase the likelihood of movement to 1.1215 - the Fibonacci level of 100.0%.
The material has been provided by InstaForex Company - www.instaforex.comvia Forecast for EUR/USD on December 17, 2019
Comments
Post a Comment