EUR/USD: plan for the European session on December 17. Euro will come under pressure after reports on the eurozone manufacturing
To open long positions on EURUSD you need:
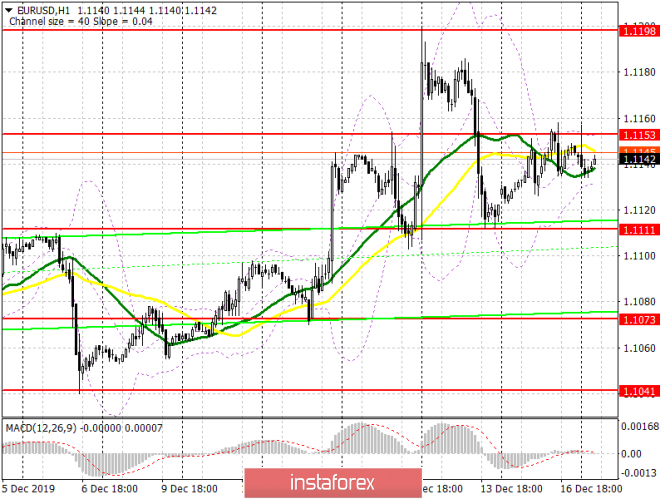
The situation is identical to the last day and the technical picture has not changed. Data on manufacturing activity in the US and business activity in the service sector did not affect the greenback in any way, even though it turned out to be quite acceptable. At the moment, buyers of the euro can still count on the level of 1.1111. However, now, when a false breakout forms in the region of this range, this will be a signal to buy the euro. In case there is a breakout of 1.1111 in the morning, after a weak report on the balance of the balance of foreign trade of the eurozone, and other important data are not released today, then it is best to count on purchases from a low of 1.1073, or immediately buy on a rebound from 1.1041. The more important task of the bulls will be to consolidate above the resistance of 1.1153, around which it had traded all day just yesterday. Its breakthrough will lead to an upward correction of EUR/USD to the area of a high of 1.1198, but the farther target of the bulls will be the level of 1.1226, where I recommend and take profits for long positions.
To open short positions on EURUSD you need:
Currently, all emphasis is on keeping the pair below the resistance of 1.1153, which the bulls have already tried several times to break yesterday, and also today at the Asian session. The next formation of a false breakout at this level, which may coincide with a weak report on the balance of the balance of foreign trade in the eurozone, will be a signal to open short positions, the purpose of which will be the lower boundary of the side channel of 1.1111. However, only a breakthrough of 1.1111 will open a direct road to the area of lows of 1.1073, and the farther target of sellers will be the area of 1.1041, where I recommend taking profits. With a EUR/USD growth scenario in the morning above 1.1153, it is best to count on sales from the high of this month in the area of 1.1198, or sell even higher from 1.1226.
Signals of indicators:
Moving averages
Trade is conducted in the region of 30 and 50 moving average, which indicates the lateral nature of the market.
Bollinger bands
Volatility is very low, which does not provide signals on entering the market.
Description of indicators
- Moving average (moving average determines the current trend by smoothing out volatility and noise). Period 50. The graph is marked in yellow.
- Moving average (moving average determines the current trend by smoothing out volatility and noise). Period 30. The graph is marked in green.
- MACD indicator (Moving Average Convergence / Divergence - moving average convergence / divergence) Fast EMA period 12. Slow EMA period 26. SMA period 9
- Bollinger Bands (Bollinger Bands). Period 20
via EUR/USD: plan for the European session on December 17. Euro will come under pressure after reports on the eurozone manufacturing
Comments
Post a Comment