Good evening, dear traders! Yesterday, we gave a trading idea for the growth of oil but paid attention to the evening news on oil reserves in the United States. Let’s analyze this situation on volumes.
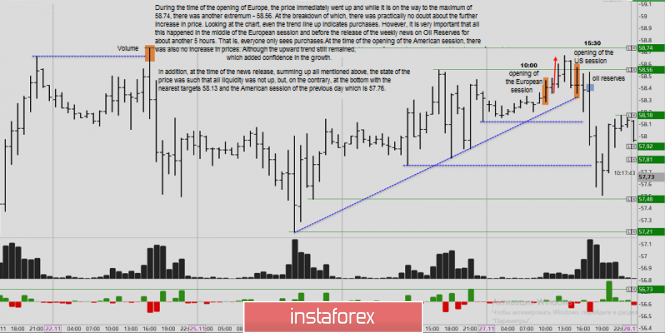
During the time of the opening of Europe, the price immediately went up and while it is on the way to the maximum of 58.74, there was another extremum - 58.56. At the breakdown of which, there was practically no doubt about the further increase in price. Looking at the chart, even the trend line up indicates purchases. However, It is very important that all this happened in the middle of the European session and before the release of the weekly news on Oil Reserves for about another 5 hours. That is, everyone only sees purchases.
At the time of the opening of the American session, there was also no increase in prices. Although the upward trend still remained, which added confidence in the growth.
In addition, at the time of the news release, summing up all mentioned above, the state of the price was such that all liquidity was not up, but, on the contrary, at the bottom with the nearest targets 58.13 and the American session of the previous day which is 57.76.
Oil’s approach to the maximum in Europe:
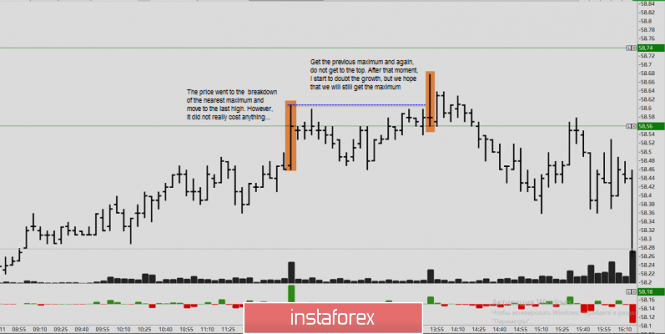
Thus, the Europeans simply didn’t have the courage to collect stocks before the reserves. Nevertheless, the stocks themselves came out large, which led to the sales of black gold.
This analysis is based on the US oil futures.
The material has been provided by InstaForex Company - www.instaforex.comvia Why didn’t the oil go upwards? Volume analysis for oil
Comments
Post a Comment