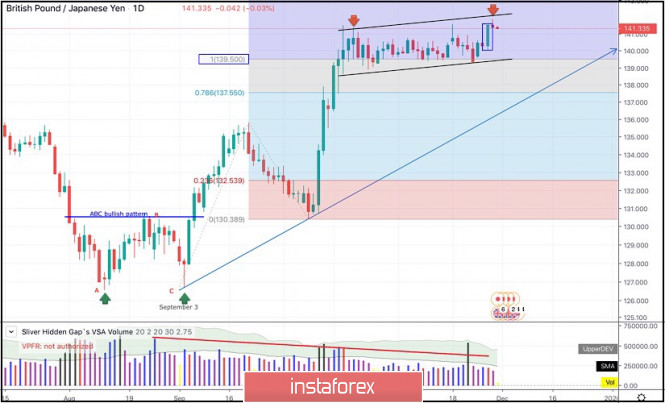
On September the 3rd, the GBPJPY pair initiated the depicted bullish movement uptrend around 126.76
This occurred after the preceding bullish ABC pattern with neckline located around 130.52 has been confirmed.
Since then, the depicted uptrend has been intact until October 17 when the pair failed to achieve a new high above 141.50 followed by the current sideway consolidation channel slightly above 139.50 (100% Fibonacci Expansion Level).
Bearish divergence has been manifested during the mentioned recent upward movement.
Moreover, On November 27, upthrust daily candlestick followed by an inverted hammer daily candlestick were manifested around 141.50 denoting a high-probability bearish reversal opportunity around the upper limit of the current movement channel (141.50-142.10).
Technically, a quick bearish decline is expected towards 139.50 initially where the nearest demand level should be located.
Trade Recommendations:
Intermediate-term outlook remains bearish as long as bearish persistence below 142.10 is maintained on the Daily chart.
Conservative traders can look for valid SELL entries anywhere around 141.50-142.10.
Initial Target levels should be located around 140.00 and 139.50.
Daily candlestick closure above 142.50 invalidates the mentioned bearish scenario.
The material has been provided by InstaForex Company - www.instaforex.comvia November 29, 2019 : GBP/JPY Intraday technical analysis and trade recommendations.
Comments
Post a Comment