This morning I would like to put attention to the commodity market. Natural Gas is vunerable to the risk-on / risk-off sentiment and any changes in oil prices.
NatGas shows a very seasonal behavior with big price movements in correspondance to winter months; the weeks before these movements started, volumes had the tendency to consistently increase.
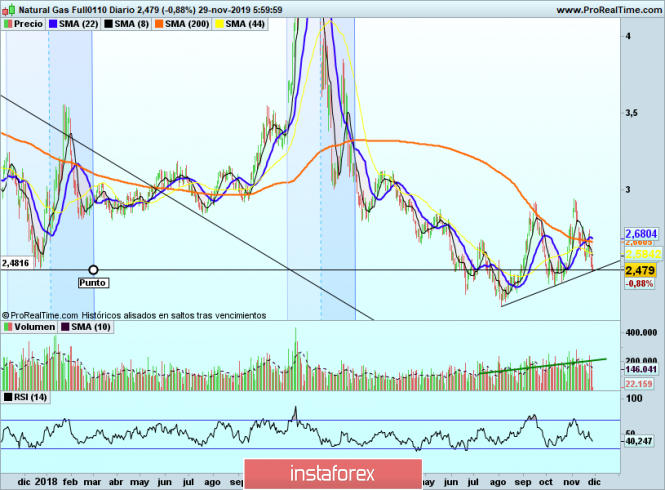
This is what has been happening during recent weeks again, an increase in contracts. The price has been edging lower in the last 20 days (-15%) but basically it has been trapped in the same range since mid-summer. Now it is just clearly testing a trendline and approaching the 2.475 level. It was the support level from where price rebounded at the end of 2017; 2.43 / 2.55 area should be observed.
Don’t get me wrong: NatGas has a clear long term structural descending prices trend, probably pushed by improvement and innovations in the production and logistic chain.
But right now, I think it’s worth having a look at how to choose a buying strategy here.
Stay safe
The material has been provided by InstaForex Company - www.instaforex.comvia NATGAS to suffer seasonal losses
Comments
Post a Comment