
Forecast for USD/JPY on November 29, 2019

USD/JPY

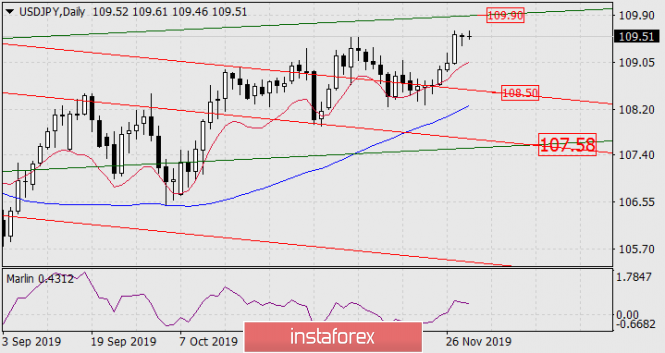
The US/DJPY pair is trying its best to grow, but it is hindered by political events in China and the unstable situation in the stock market. Major Asian indices are trading just below zero, Hong Kong’s Hang Seng is knocked out of this series, losing 1.61% due to US pressure to pass its own Human Rights and Democracy Act in Hong Kong. There is not much left until the target level of 109.90 - to the line of the green ascending price channel. Upon reaching the level, a decisive reduction in prices is possible, here the first goal will be to support the red price channel around 108.50. The MACD line is also striving for the same mark on the daily chart. With overcoming the first goal, the second opens - the intersection point of two lines of price channels - 107.58.

analytics5de089ba765c4.png

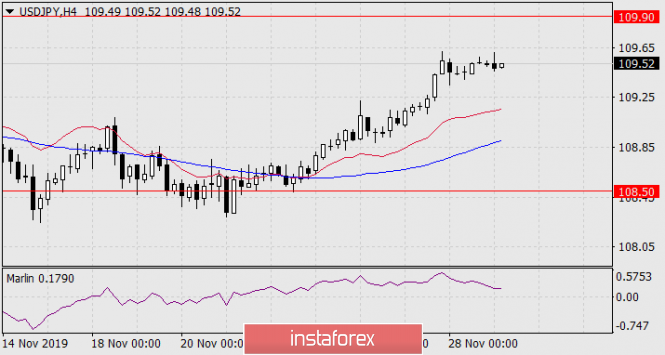
On a four-hour chart, the price is above the indicator lines of balance and MACD, the line of the Marlin oscillator is falling, which may be preparation for the formation of divergence in case of price growth. Wait for the development of events - purchases, as well as sales from current levels, carry the same risks.

analytics5de089d016646.png

The material has been provided by InstaForex Company - www.instaforex.com
via Forecast for USD/JPY on November 29, 2019

Comments

Popular posts from this blog

GBPUSD up and down. Back down testing 61.8% and swing area.

# GBPUSD tests 61.8% and swing area The GBPUSD is in an up and down day. The    GBPUSD  moved higher earlier. That move was helped by better than expected retail sales. However the high price today stalled near the high price from last week near 1.3643, and rotated back lower on the USD buying. The subsequent move lower now has the price back toward the 61.8% retracement along with a swing area between 1.35969 and 1.36034. As I type, the price has dipped below that swing area. What next? If the price can stay below the 1.36034 area, that would be the best case scenario for the sellers with the next major targets coming in at the 100 hour moving average 1.3569 (blue line), and the 200 hour moving average at 1.35609 (green line). The 50% midpoint of the 2022 trading range is just below those levels at 1.35526 and would be a another target on further weakness. A move back above 1.36034 with momentum would have traders looking again toward 1.3618 to 1.36271 and then t...