GBP/USD
The British pound slightly fell (by 11 points) amid the general calm background that was on the market yesterday, where it found support for a lower time frame. The signal line of the Marlin oscillator moves horizontally below the boundary with the growth territory, this increases its sensitivity to price changes, that is, the oscillator loses its leading function.
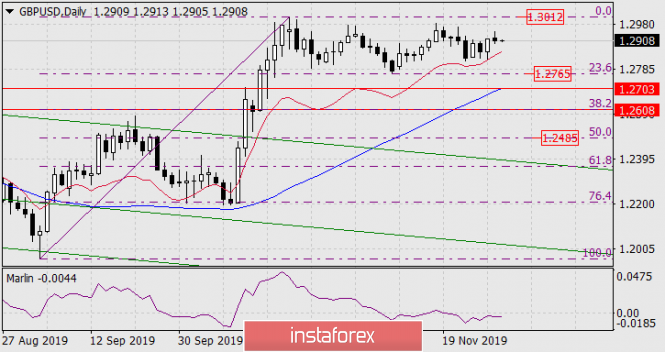
The general trend continues to grow, the MACD line moves straight up. Target level at 1.3012 is becoming more tangible. The receipt of a powerful positive from the fundamental component can extend the growth to the price channel line in the region of 1.3144.
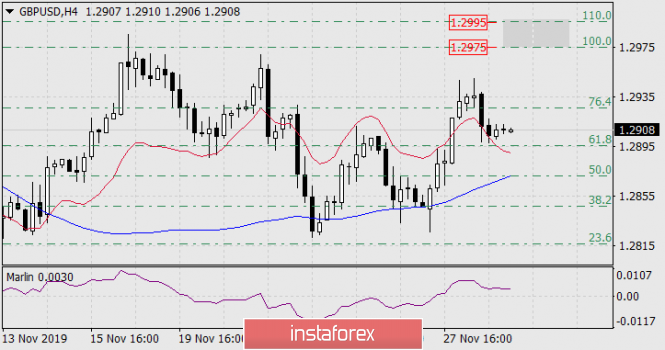
On the four-hour chart, yesterday, the price found support at the Fibonacci level of 61.8% and on the balance indicator line. The Marlin signal line in the growth zone. We look forward to an attempt for the price to grow to the target range of 1.2975/95, given the Fibonacci levels of 100.0% and 110.0%. From this range, a price reversal is possible and the 1.3012 target will not be achieved. Unless, of course, the next “excellent” Brexit news (which are essentially ordinary, but speculators make a big deal out of them) doesn’t interfere.
The material has been provided by InstaForex Company - www.instaforex.comvia Forecast for GBP/USD on November 29, 2019
Comments
Post a Comment