Technical Market Overview:
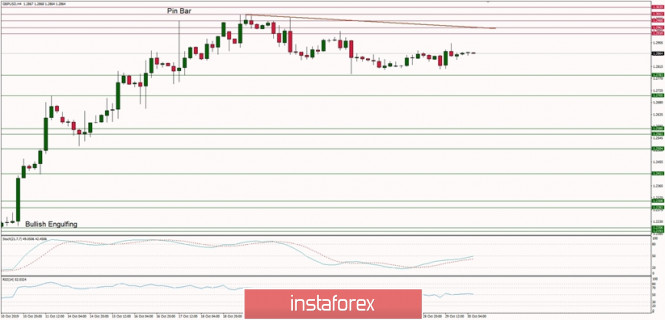
The volatility on the GBP/USD market has clearly dried up and Cable is still being locked in a narrow horizontal range located between the levels of 1.2783 - 1.2865 as no major breakout occurred yet. The market participants await a breakout in any direction, but on the other hand, the market might be making the Bullish Flag or Pennant pattern as well. Despite the neutral momentum, the bears are getting more active and try to push the prices lower towards the next technical support located at the level of 1.2783. The key technical support is still located at the level of 1.2561. The larger timeframe trend remains bearish.
Weekly Pivot Points:
WR3 - 1.3149
WR2 - 1.3068
WR1 - 1.2923
Weekly Pivot - 1.2842
WS1 - 1.2710
WS2 - 1.2624
WS3 - 1.2478
Trading Recommendations:
The best strategy for current market conditions is to trade with the larger timeframe trend, which is down. All upward moves will be treated as local corrections in the downtrend. In order to reverse the trend from down to up, the key level for bulls is seen at 1.3000 and it must be clearly violated. The key long-term technical support is seen at the level of 1.2231 - 1.2224 and the key long-term technical resistance is located at the level of 1.3509. As long as the price is trading below this level, the downtrend continues towards the level of 1.1957 and below.
via Technical analysis of GBP/USD for 30/10/2019
Comments
Post a Comment