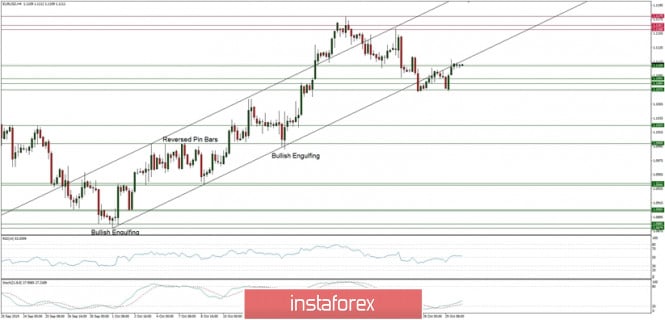
Technical Market Overview:
The bounce from the level of 1.1075 was successful and bulls are trying again to get back into the ascending channel. Currently, the price is testing the level of 1.1109 which is a local technical resistnace. The volatility has slightly increased and the overall market participants’ activity is more visible. The momentum is now slightly positive, but there is still a chance for another leg up after the breakout, the next target for bulls is seen at the level of 1.1160.
Weekly Pivot Points:
WR3 - 1.1242
WR2 - 1.1207
WR1 - 1.1134
Weekly Pivot - 1.1103
WS1 - 1.1028
WS2 - 1.0992
WS3 - 1.0922
Trading Recommendations:
The best strategy for current market conditions is to trade with the larger timeframe trend, which is down. All upward moves will be treated as local corrections in the downtrend. The downtrend is valid as long as it is terminated or the level of 1.1445 clearly violated. There is an Ending Diagonal price pattern visible on the larget timeframes that indicate a possible downtrend termination soon. The key short-term levels are technical support at the level of 1.0999 and the technical resistance at the level of 1.1267.
via Technical analysis of EUR/USD for 30/10/2019
Comments
Post a Comment