
Forecast for GBP/USD on October 31, 2019

GBP / USD

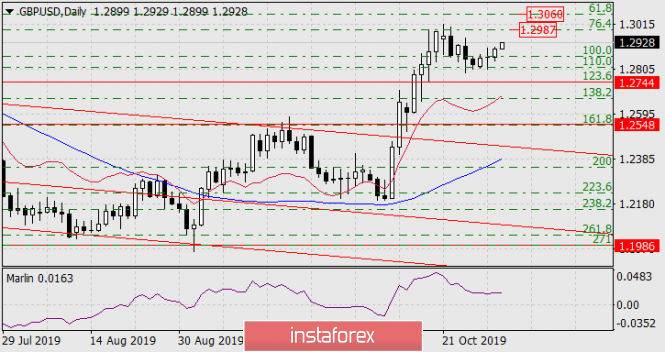
As a result of Wednesday, the pound has grown by 44 points after the Fed trims the rate from 2.00% to 1.75%. On the daily chart, the Marlin Oscillator is reluctant to turn after the price, which warns of a short-term growth prospect. The immediate goal is the Fibonacci level of 76.4% at the price of 1.2987. Overcoming the level will make it possible for the price to grow further to the Fibonacci level of 61.8% at the price of 1.3060.

analytics5dba635060601.png

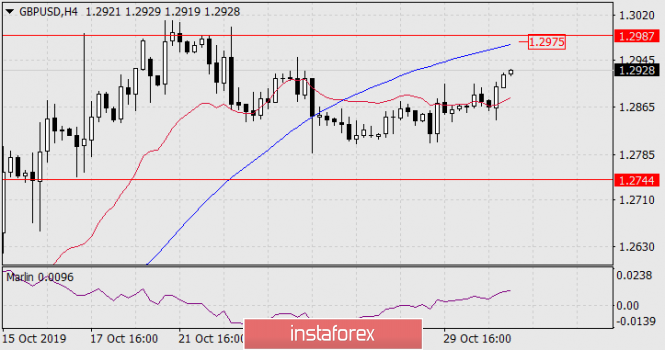
On the four-hour chart, the price went above the red indicator line of the balance, shifting the local market sentiment towards purchases, but the MACD line is located near the target level at the Fibonacci level of 1.2987. This range (1.2975 / 87) will now be the target.

analytics5dba6365526b6.png

The material has been provided by InstaForex Company - www.instaforex.com
via Forecast for GBP/USD on October 31, 2019

Comments

Popular posts from this blog

GBPUSD up and down. Back down testing 61.8% and swing area.

# GBPUSD tests 61.8% and swing area The GBPUSD is in an up and down day. The    GBPUSD  moved higher earlier. That move was helped by better than expected retail sales. However the high price today stalled near the high price from last week near 1.3643, and rotated back lower on the USD buying. The subsequent move lower now has the price back toward the 61.8% retracement along with a swing area between 1.35969 and 1.36034. As I type, the price has dipped below that swing area. What next? If the price can stay below the 1.36034 area, that would be the best case scenario for the sellers with the next major targets coming in at the 100 hour moving average 1.3569 (blue line), and the 200 hour moving average at 1.35609 (green line). The 50% midpoint of the 2022 trading range is just below those levels at 1.35526 and would be a another target on further weakness. A move back above 1.36034 with momentum would have traders looking again toward 1.3618 to 1.36271 and then t...