EUR/USD: plan for the European session on October 31. The Fed lowers rates, but announces a pause in the cycle. Bulls need
To open long positions on EURUSD you need:
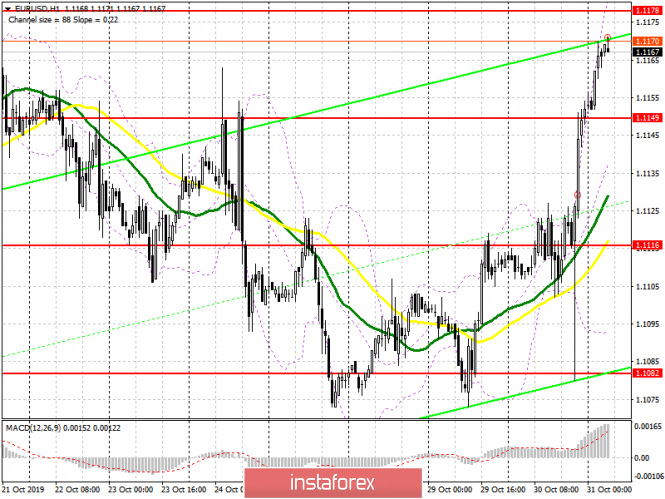
Euro growth resumed after the Federal Reserve decided to lower interest rates. Even though many expected this event, buyers managed to break above the resistance of 1.1149, which quickly pushed the pair to the highs of this month. The main goal of the bulls in the first half of the day will be to break through the range of 1.1178, but this can only be done if good fundamental statistics on inflation in the eurozone and GDP growth are achieved. The breakdown of the high of 1.1178 opens a direct path to a new resistance of 1.1226 and 1.1289, where I recommend profit taking. If the data on the eurozone turn out to be worse than the forecasts of economists, the scenario of EUR/USD return to the support area of 1.1149 is not ruled out. It is best to open long positions from there only after the formation of a false breakout. I recommend buying immediately on the rebound only from the larger area of support for this week at 1.1116.
To open short positions on EURUSD you need:
Euro sellers will be concentrated in a false breakout in the region of a high of this month at 1.1178, which will be the first signal to open short positions in EUR/USD, the purpose of which will be a support of 1.1149. But it will be possible to break below this range provided that the inflation and economic growth rates of the eurozone are weak. Breakthrough at 1.1149 will raise the pressure on the pair, which will lead to a return to the area of lows of 1.1116 and 1.1082, where I recommend profit taking. If the euro rises in the morning above the resistance of 1.1178, it is best to return to short positions to rebound from highs of 1.1226 and 1.1289.
Signals of indicators:
Moving averages
Trade is conducted above 30 and 50 moving averages, which indicates the advantage of buyers of the euro.
Bollinger bands
In the event of a decline, support will be provided by the average boundary of the indicator at 1.1135, and you can buy for a rebound immediately from the lower level of 1.1090.
Description of indicators
- MA (moving average) 50 days - yellow
- MA (moving average) 30 days - green
- MACD: Fast EMA 12, Slow EMA 26, SMA 9
- Bollinger Bands 20
via EUR/USD: plan for the European session on October 31. The Fed lowers rates, but announces a pause in the cycle. Bulls need
Comments
Post a Comment