Technical Market Overview:
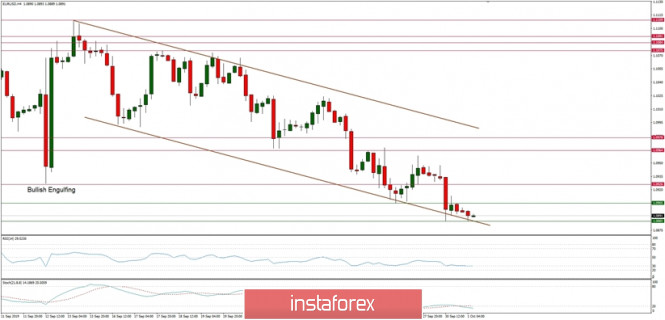
The newest lower low on EUR/USD market was made at the level of 1.0885. The bulls are trying to bounce, but so far they were capped by the nearest technical resistance located at the level of 1.0964. The short-term and long-term trend is still down, but due to the extremely oversold market conditions, the bulls still have a chance for a move towards the level of 1.0964 and higher towards the level of 1.0978. The next target for bears is seen at the level of 1.0817.
Weekly Pivot Points:
WR3 - 1.1116
WR2 - 1.1087
WR1 - 1.0996
Weekly Pivot - 1.0951
WS1 - 1.0872
WS2 - 1.0826
WS3 - 1.0757
Trading Recommendations:
The best strategy for current market conditions is to trade with the larger timeframe trend, which is down. All upward moves will be treated as local corrections in the downtrend. The downtrend is valid as long as it is terminated or the level of 1.1445 clearly violated. There is an Ending Diagonal price pattern visible on the larget timeframes that indicate a possible downtrend termination soon. The key short-term levels are technical support at the level of 1.0926 and the technical resistance at the level of 1.1267.
via Technical analysis of EUR/USD for 01/10/2019
Comments
Post a Comment