
Technical analysis for the EUR/USD currency pair for the week from September 30 to October 5

Trend analysis.

This week, after testing the target level of 161.8%, the price will try to start moving upwards in a pullback with the first target of 1.0978 – a pullback level of 14.6% (blue dotted line).

analytics5d91a5af74581.png

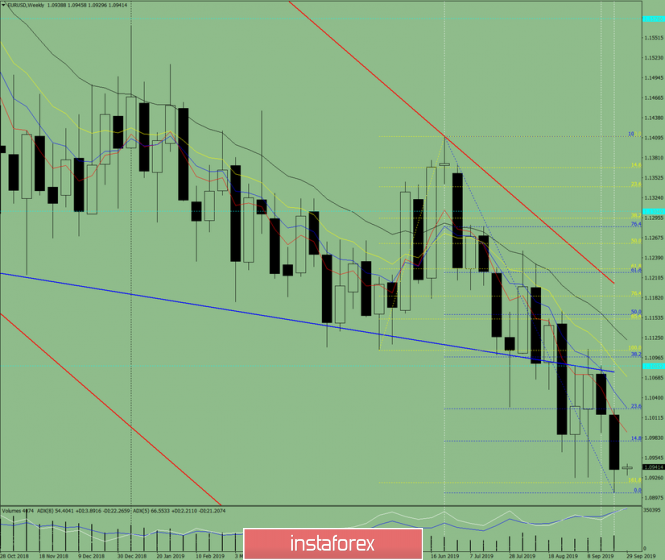
Fig. 1 (weekly chart).

Complex analysis:

- Indicator analysis – up;

- Fibonacci levels – up;

- Volumes – up;

- Candlestick analysis – neutral;

- Trend analysis – down;

- Bollinger Bands – down;

- Monthly chart – up.

The conclusion of the complex analysis – an upward movement.

The total result of calculating the candle of the EUR/USD currency pair according to the weekly chart: the price for weeks is more likely to have an upward trend with the absence of the first lower shadow of the weekly white candlestick (Monday – up) and the presence of the second upper shadow (Friday – down).

The material has been provided by InstaForex Company - www.instaforex.com
via Technical analysis for the EUR/USD currency pair for the week from September 30 to October 5

Comments

Popular posts from this blog

GBPUSD up and down. Back down testing 61.8% and swing area.

# GBPUSD tests 61.8% and swing area The GBPUSD is in an up and down day. The    GBPUSD  moved higher earlier. That move was helped by better than expected retail sales. However the high price today stalled near the high price from last week near 1.3643, and rotated back lower on the USD buying. The subsequent move lower now has the price back toward the 61.8% retracement along with a swing area between 1.35969 and 1.36034. As I type, the price has dipped below that swing area. What next? If the price can stay below the 1.36034 area, that would be the best case scenario for the sellers with the next major targets coming in at the 100 hour moving average 1.3569 (blue line), and the 200 hour moving average at 1.35609 (green line). The 50% midpoint of the 2022 trading range is just below those levels at 1.35526 and would be a another target on further weakness. A move back above 1.36034 with momentum would have traders looking again toward 1.3618 to 1.36271 and then t...