
Forecast for AUD/USD on October 1, 2019

AUD / USD

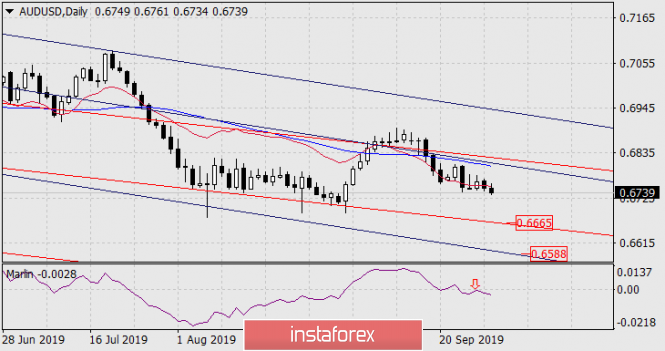
The Reserve Bank of Australia may lower the rate from 1.00% to 0.75% today at 4:30 London time. In anticipation of this, the Australian dollar is declining for the second day in a row. On the daily chart, the price has consolidated below the red balance indicator line. The Marlin indicator on daily after a reversal from the boundary with the growth territory continues to decline. The immediate goal of the decline is the embedded line of the red price channel 0.6665, behind it is the line of the blue price channel with the target mark of 0.6588.

analytics5d92c6004defc.png

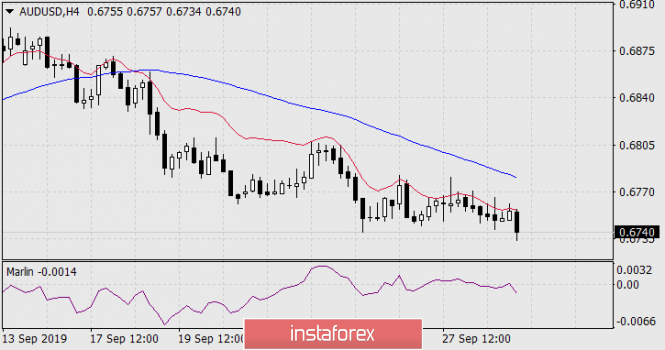
On a four-hour chart, the price is developing in a downward trend below the balance line. The Marlin oscillator in the negative trend territory.

analytics5d92c61557bdb.png

The material has been provided by InstaForex Company - www.instaforex.com
via Forecast for AUD/USD on October 1, 2019

Comments

Popular posts from this blog

GBPUSD up and down. Back down testing 61.8% and swing area.

# GBPUSD tests 61.8% and swing area The GBPUSD is in an up and down day. The    GBPUSD  moved higher earlier. That move was helped by better than expected retail sales. However the high price today stalled near the high price from last week near 1.3643, and rotated back lower on the USD buying. The subsequent move lower now has the price back toward the 61.8% retracement along with a swing area between 1.35969 and 1.36034. As I type, the price has dipped below that swing area. What next? If the price can stay below the 1.36034 area, that would be the best case scenario for the sellers with the next major targets coming in at the 100 hour moving average 1.3569 (blue line), and the 200 hour moving average at 1.35609 (green line). The 50% midpoint of the 2022 trading range is just below those levels at 1.35526 and would be a another target on further weakness. A move back above 1.36034 with momentum would have traders looking again toward 1.3618 to 1.36271 and then t...