EUR/USD: plan for the European session on September 30. Bears showed active resistance around 1.0958
To open long positions on EURUSD you need:
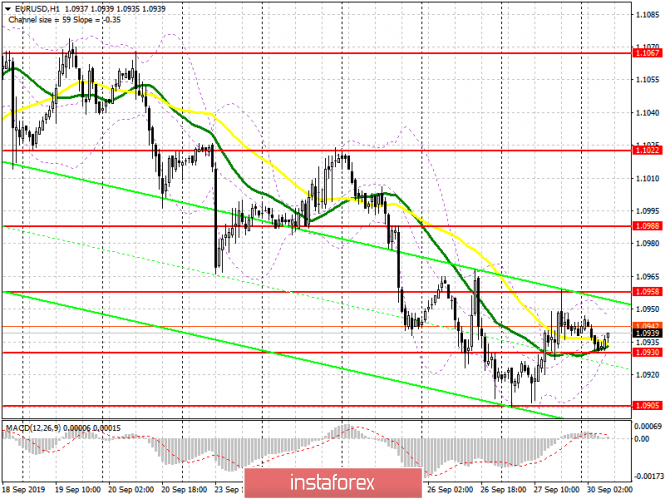
Further growth of the European currency will directly depend today on a number of fundamental statistics that are published for the countries of the eurozone. Particular attention was on the report on the unemployment rate in the eurozone and the German consumer price index. An important task of the bulls will be the retention and formation of a false breakdown at the level of 1.0930, since only after this we can talk about maintaining the upward correction. However, a more important goal will be a breakthrough and consolidation above the resistance level of 1.0958, which will lead to continued growth and updating the high of 1.0988, where I recommend taking profits. In case of weak fundamental data, it is best to expect buyers to return to the market after updating a low of 1.0905, or on a rebound from a larger support of 1.0873.
To open short positions on EURUSD you need:
Sellers should push EUR/USD below the support of 1.0930, which will lead to the demolition of a number of stop orders and a further downward movement to the low of 1.0905. Its breakdown will depend on a number of statistics on the eurozone and Germany, as weak reports will further increase pressure on the euro, and lead to a test of lows 1.0873 and 1.0840, where I recommend taking profits. In case of an upward correction, the upper boundary of the downward price channel, which borders on the resistance of 1.0958, will act as resistance. The formation of a false breakdown there will be a direct signal to open new short positions along the trend.
Signals of indicators:
Moving averages
Trading is carried out in the region of 30 and 50 moving average, which indicates a possible stop of the downward trend.
Bollinger bands
In the event of EUR/USD decline in the first half of the day, a break of the lower boundary of the indicator at 1.0930 will increase the pressure on the euro.
Description of indicators
- MA (moving average) 50 days - yellow
- MA (moving average) 30 days - green
- MACD: Fast EMA 12, Slow EMA 26, SMA 9
- Bollinger Bands 20
via EUR/USD: plan for the European session on September 30. Bears showed active resistance around 1.0958
Comments
Post a Comment