
Technical analysis of GBP/USD for 29/08/2019:

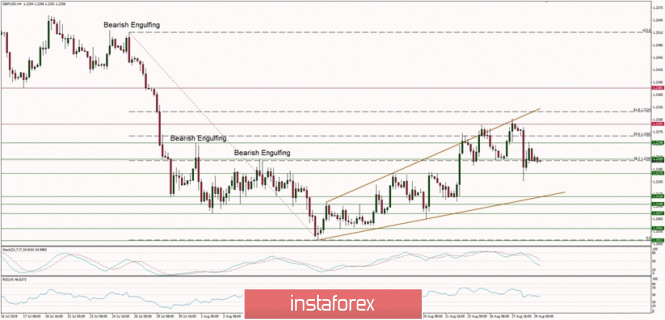
Technical Market Overview:

The GBP/USD pair has reversed down after hitting the level of 1.2308 which is located just below the 61% Fibonacci retracement at 1.2324. The Broadening Wedge price pattern might have been completed then because the price has broken below the technical support at the level of 1.2248 and 1.2175. The whole move up is still a part of the correction, because it does not look like the beginning of a new, impulsive trend. The pair is currently testing the nearest technical support located at the level of 1.2156 in overbought market conditions.

Weekly Pivot Points:

WR3 - 1.2616

WR2 - 1.2455

WR1 - 1.2395

Weekly Pivot Pont - 1.2226

WS1 - 1.2161

WS2 - 1.2001

WS3 - 1.1935

Trading Recommendations:

The best strategy for current market conditions is to trade with the larger timeframe trend, which is down. All upward moves will be treated as local corrections in the downtrend. In order to reverse the trend from down to up, the key level for bulls is seen at 1.2429 and it must be clearly violated. As long as the price is trading below this level, the downtrend continues.

analytics5d6765cd51e05.jpg

The material has been provided by InstaForex Company - www.instaforex.com
via Technical analysis of GBP/USD for 29/08/2019:

Comments

Popular posts from this blog

GBPUSD up and down. Back down testing 61.8% and swing area.

# GBPUSD tests 61.8% and swing area The GBPUSD is in an up and down day. The    GBPUSD  moved higher earlier. That move was helped by better than expected retail sales. However the high price today stalled near the high price from last week near 1.3643, and rotated back lower on the USD buying. The subsequent move lower now has the price back toward the 61.8% retracement along with a swing area between 1.35969 and 1.36034. As I type, the price has dipped below that swing area. What next? If the price can stay below the 1.36034 area, that would be the best case scenario for the sellers with the next major targets coming in at the 100 hour moving average 1.3569 (blue line), and the 200 hour moving average at 1.35609 (green line). The 50% midpoint of the 2022 trading range is just below those levels at 1.35526 and would be a another target on further weakness. A move back above 1.36034 with momentum would have traders looking again toward 1.3618 to 1.36271 and then t...