Technical Market Overview:
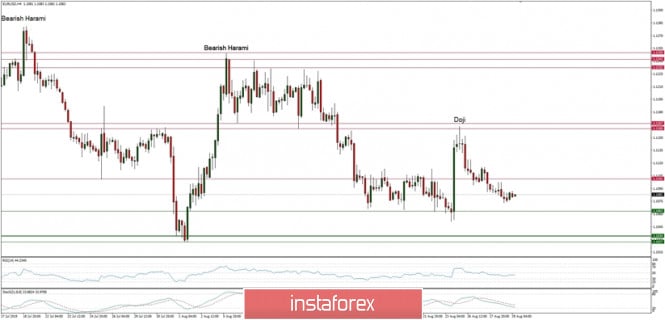
The EUR/USD pair keeps trading below the 61% of the Fibonacci retracement and the last lower low was made at the level of 1.1073. The bears are clearly in control of this market despite the low volatility conditions. The momentum returned to the neutral level and the market conditions are now coming off the overbought levels as well. Please keep an eye on the current developments as any move lower can change the market positioning for the next days.
Weekly Pivot Points:
WR3 - 1.1293
WR2 - 1.1218
WR1 - 1.1193
Weekly Pivot Pont - 1.1119
WS1 - 1.1089
WS2 - 1.1014
WS3 - 1.0984
Trading Recommendations:
The best strategy for current market conditions is to trade with the larger timeframe trend, which is down. All upward moves will be treated as local corrections in the downtrend. The downtrend is valid as long as it is terminated or the level of 1.1445 clearly violated. There is an Ending Diagonal price pattern visible on the larget timeframes that indicate a possible downtrend termination soon. The key short-term levels are technical support at the level of 1.1027 and the technical resistance at the level of 1.1250.
via Technical analysis of EUR/USD for 29/08/2019:
Comments
Post a Comment