Crypto Industry News:
Hong Kong’s pro-democratic, anti-government protest movement is stimulating a wider adoption of cryptocurrencies such as Bitcoin.
Financial portals report that political unrest in Hong Kong - which has just entered the 12th week - has prompted several local businesses and individuals to switch to non-sovereign and decentralized digital currencies. On August 26, Pricerite department store in Hong Kong announced that it would begin accepting Bitcoin, Litecoin and Ethereum at its fourteen locations in Hong Kong. The store has indicated that it will be able to quickly convert crypto to Hong Kong dollars using the Bitcoin’s Lightning Network scalability layer. In addition to traditional retailers, the cryptocurrency company Genesis Block operates 14 cryptocurrency ATMs throughout the city.
In July, Genesis Block - which it trades under the name “CoinHere” - distributed water to protesters who were paid for using international donations in Bitcoin Cash, as well as umbrellas - a symbolic reference to the 2014 umbrella revolution in this city.
The increase in interest in cryptocurrencies appears against the background of other forms of economic activism. Earlier this month, protesters began withdrawing as much money as possible from bank accounts or converting the local currency to US dollars.
This had a dual purpose, serving both as precautionary protection of their personal property and by sending a sharp warning to the Chinese authorities. What’s more, it was reported in June that many of Hong Kong’s tycoons - a city of 853 people with assets worth over $ 100 million - began to transfer their assets abroad.
If the protest movement fails to prevent the entry into force of the controversial Chinese extradition law, the Chinese continental authorities will have the right to demand that Hong Kong courts freeze and confiscate assets related to crimes committed on the continent.
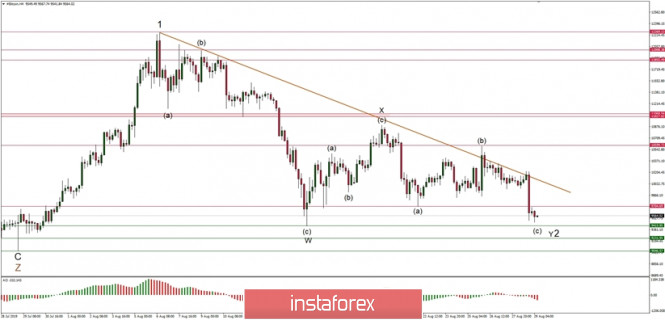
Technical Market Overview:
The BTC/USD pair has broken below the trendline support around the level of $9,990 after a failure to break through the upper trendline resistance around the level of $10,200. The bears were able to make a new local low at the level of $9,466 and since then the market did not bounce much. Currently, the price is trading around the level of $9,534, just above the low of the old wave W of the overall corrective cycle. Any violation of this level will lead to sell-off acceleration towards the level of $9,046.
Weekly Pivot Points:
WR3 - $11,710
WR2 - $11,306
WR1 - $10,534
Weekly Pivot Pont - $10,091
WS1 - $9,320
WS2 - $8,854
WS3 - $8,140
Trading Recommendations:
The best strategy in the current market conditions is to trade with the larger timeframe trend, which is still up. All the shorter timeframe moves are being treated as a correction inside of the uptrend. The larger degree WXY correction might have been completed and the market might be ready for another impulsive wave up of a higher degree. Any violation of the level of $9,049 invalidates the bullish impulsive scenario.
via Technical analysis of BTC/USD for 29/08/2019:
Comments
Post a Comment