
Forecast for GBP/USD on August 29, 2019

GBP/USD

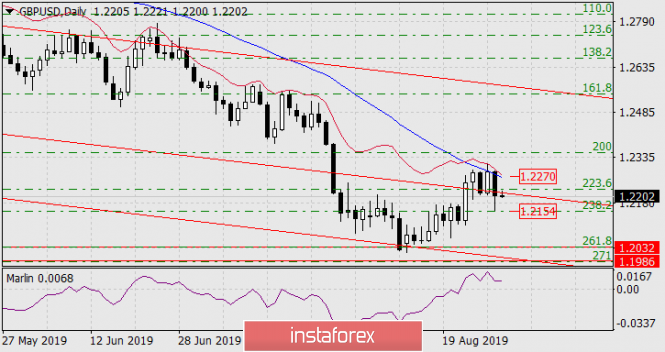
The British pound at the time of yesterday’s fall was losing 133 points, reaching the first target of a 238.2% Fibonacci reaction. The Marlin Oscillator on the daily chart showed a reversal down.

analytics5d675c7020325.png

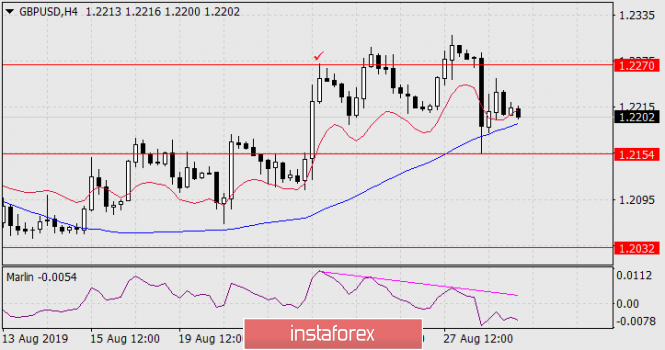
On the four-hour chart, the double divergence worked in all its splendor - the price attacked the support of the MACD line, the Marlin oscillator itself is completely in a downward position. Currently, the price is struggling with the support of the balance line (indicator red) and intends to gain a foothold below the MACD line. Success will lead to a repeated attack on the Fibonacci level of 238.2% of the daily scale, and consolidation below it opens up to 261.8% at the price of 1.2032 to the Fibonacci level.

analytics5d675c8493b6f.png

The material has been provided by InstaForex Company - www.instaforex.com
via Forecast for GBP/USD on August 29, 2019

Comments

Popular posts from this blog

GBPUSD up and down. Back down testing 61.8% and swing area.

# GBPUSD tests 61.8% and swing area The GBPUSD is in an up and down day. The    GBPUSD  moved higher earlier. That move was helped by better than expected retail sales. However the high price today stalled near the high price from last week near 1.3643, and rotated back lower on the USD buying. The subsequent move lower now has the price back toward the 61.8% retracement along with a swing area between 1.35969 and 1.36034. As I type, the price has dipped below that swing area. What next? If the price can stay below the 1.36034 area, that would be the best case scenario for the sellers with the next major targets coming in at the 100 hour moving average 1.3569 (blue line), and the 200 hour moving average at 1.35609 (green line). The 50% midpoint of the 2022 trading range is just below those levels at 1.35526 and would be a another target on further weakness. A move back above 1.36034 with momentum would have traders looking again toward 1.3618 to 1.36271 and then t...