
Forecast for EUR/USD on August 29, 2019

EUR/USD

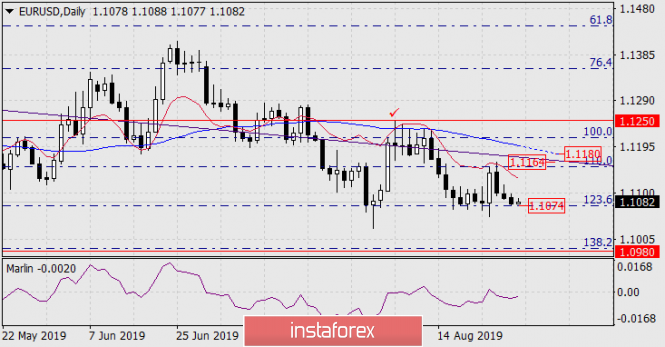
On Wednesday, the euro fell by 13 points, reaching an important technical level of 123.6% of the Fibonacci level of the basic movement from September 24-November 12, 2018, consolidation under which opens the way to a decline to the next level of 138.2%, to the area of 1.0980. Today in the Asian session, the price is slightly correcting upwards. The signal line of the Marlin oscillator remains in the negative zone.

analytics5d675de1ae697.png

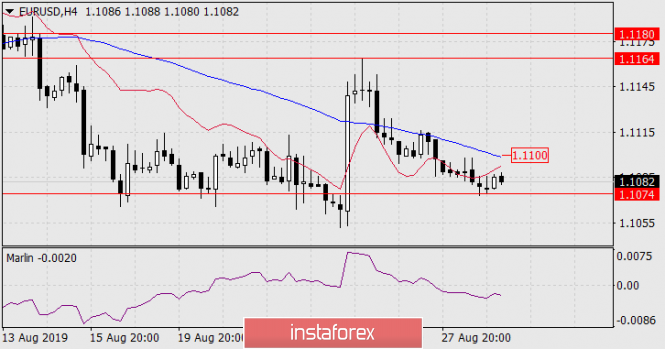
On the four-hour chart, theMarlin is also in the decline zone, the price is developing below the indicator lines of balance and MACD, the last of which creates resistance at a price of 1.1100. Consolidating the price above this level will allow the correction to increase, perhaps the price will fall into the range of 1.1164/80, formed on the daily scale by the line of the price channel and the MACD line. The lower limit of the range coincides with the peak on August 26. The predominant option for further development remains downward, that is, with the price consolidation at 1.1074.

analytics5d675df71d587.png

The material has been provided by InstaForex Company - www.instaforex.com
via Forecast for EUR/USD on August 29, 2019

Comments

Popular posts from this blog

GBPUSD up and down. Back down testing 61.8% and swing area.

# GBPUSD tests 61.8% and swing area The GBPUSD is in an up and down day. The    GBPUSD  moved higher earlier. That move was helped by better than expected retail sales. However the high price today stalled near the high price from last week near 1.3643, and rotated back lower on the USD buying. The subsequent move lower now has the price back toward the 61.8% retracement along with a swing area between 1.35969 and 1.36034. As I type, the price has dipped below that swing area. What next? If the price can stay below the 1.36034 area, that would be the best case scenario for the sellers with the next major targets coming in at the 100 hour moving average 1.3569 (blue line), and the 200 hour moving average at 1.35609 (green line). The 50% midpoint of the 2022 trading range is just below those levels at 1.35526 and would be a another target on further weakness. A move back above 1.36034 with momentum would have traders looking again toward 1.3618 to 1.36271 and then t...